Now I will try to show you, how to generate a specification for your own requirements.
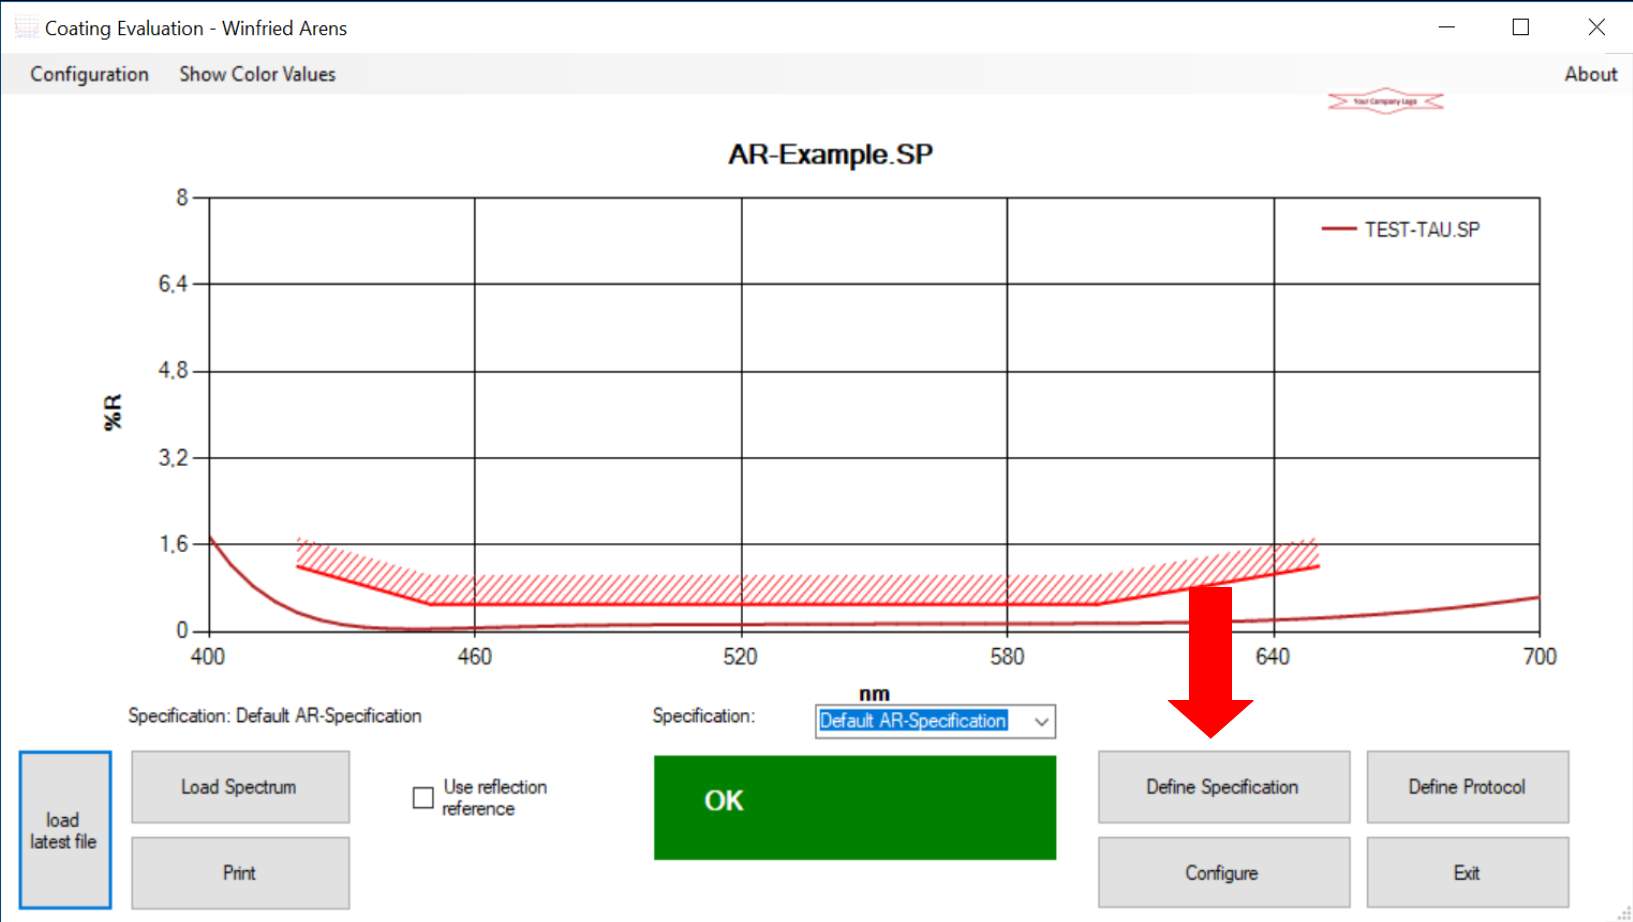
To start it, you select the almost obvious "Define Specification" button:
Then the essential dialog for generating and defining specifications appears:
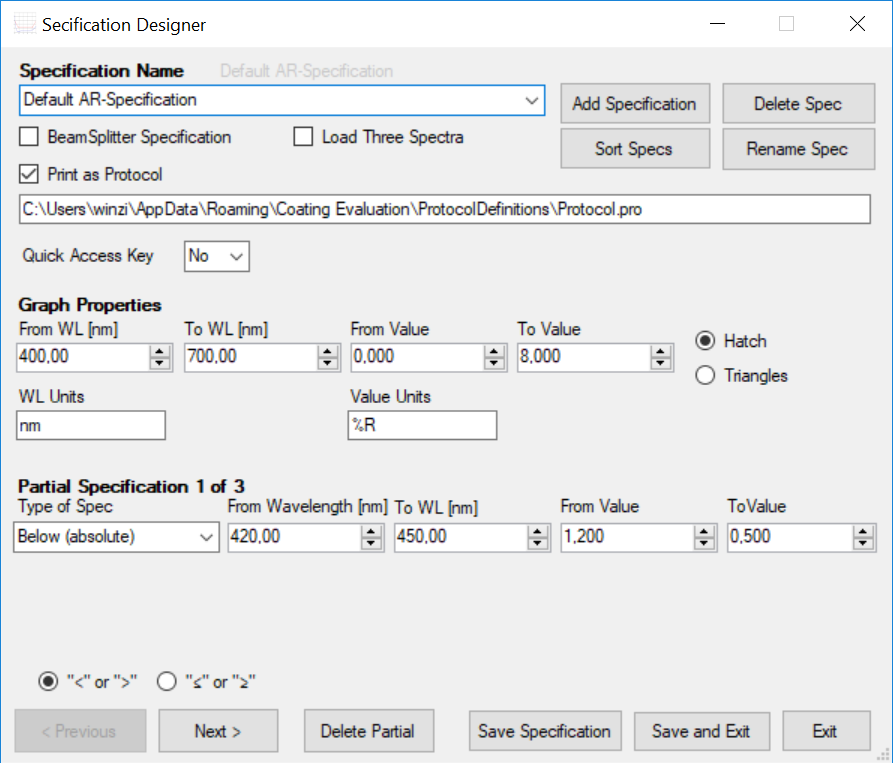
Here you can generate new specifications, modify existing specifications etc. But we will walk through it spep by step...
Starting at the top of the dialog, there is a drop down select box, where you can select between the existing specifications.
On the top right there are four Butons: "Add Specification", "Delete Spec", "Sort Specs" and "Rename Specification". They all do what they say, but we will now only discuss the "Add Specification"-Button. If you press/click it, the program will start defining a new specification. As a first action it will ask you for a name for the specification. You may type in anything you want, but of course it makes sense, if the name is somehow explanatory for what you specify (I used a slightly stupid name for the specification here, as it is just for documentation...):
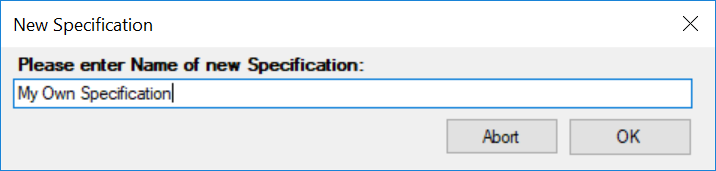
When you press "OK" now a new specification will have been generated.
Now let's go through the dialog step by step. There are three check boxes right under the specification name:
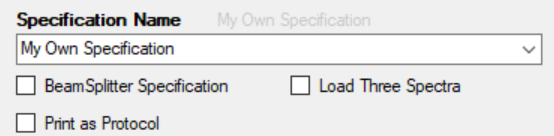
The first one "Beam Splitter Specification" allows when checked to load two spectra to specify the behaviour of a beam splitter (e.g. transmission and reflection). Both specifications can be defined separately. If it is selected the "Load three spectra" will change into "Polarizing Beamsplitter". When the latter is also selected, than specifications can be given for s-pol, p-pol and average (that is calculated as the arithmetic mean of s-pol and p-pol spectrum). Both spectra need to be measured with the same parameters regarding wavelength range, step width and number of measurement points per wavelength.
The second check box "load three spectra" also allows to load three spectral files and to specify their requirements separately. This might be good for metallic beam splitters, where you want to give specifications for transmission, reflection and absorption.
The third check box "Print as Protocol" changes the behaviour when printing. If it is checkd, a new textfield will appear giving the path to a protocol definition file:

When you click into this text-box, a file selection dialog comes up letting you select a protocol definition file ("*.pro"). How these are defined and what they can do is the topic of another HowTo.
Going further down in the dialog we find a select box and another check-box:
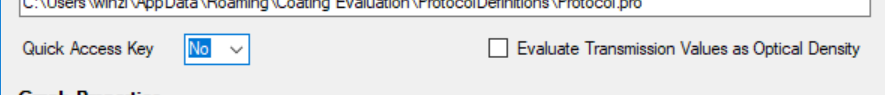
With the "Quick Access Key" select box, you can select a function key (the F1 to F12 keys at the top of the keyboard), that can be connected with this specification, so by pressing the Fx-Key you can select often used specifications with a single keystroke.
If the "Evaluate Transmission Value as Optical Density" checkbox is selected, the software will assume that it reads in transmission values and calculates OD values from these measured values. It is in the responsibility of the user to not load files that physically don't make sense. It was necessary to implement this feature, because some spectrometers save transmission values, even if the measurement software shows optical density. It may come in handy, if you want to know or specify optical density and you only have transmission data available.
The next things to ba adjusted are the properties of the graph showing your curves:
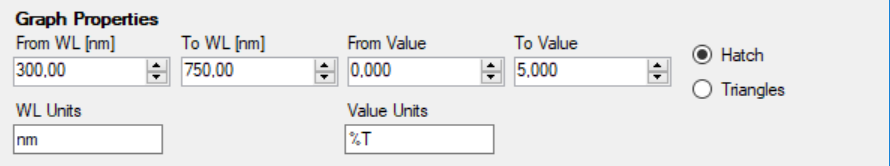
In the upper row you can adjust the extension of the graph in the main program window in x and y. Below that you can insert the units printed at the axes of the graph. Its the users responsibility not to print "%T" on a reflection measurement. Unfortunately - depending on the instrument and its software - some spectrometer files do not contain a correct indication on what type of measurement really is in the file. The other possible situation is that the you have used an insert for a spectrometer and have measured something in transmission mode, so your instrument was not "aware" of the real measurement taken, but you want it plotted correctly.
On the right, you can select between Hatch ad Triangle representation of the specification limits - the hatch version is only for the "simpler" specifications and is no loger in the examples given it the newest ISO 9211-2.
Anyhow, as you see these changes life, it should not be to hard to do the right selections.
Finally we get to the specification itself:
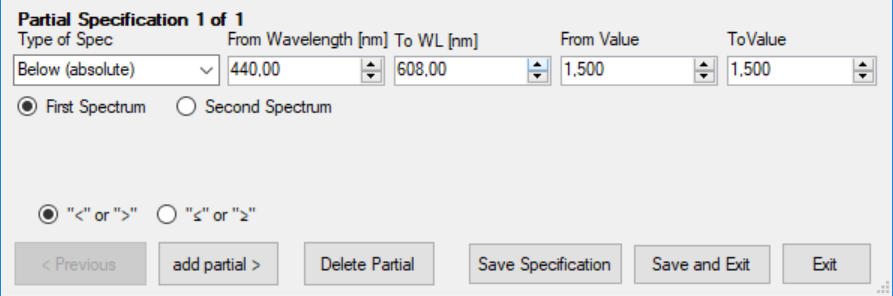
As a first piece of text it says "Partial specification x of y" - this is important for the concept:
If you want to specify that a coating shall have a transmission of >95% in the visible and <5% in the infrared, you need to have two partial specifications: The first one says "Transmission curve above 90% from 420nm to 650nm" (from wavelength=420, to WL=650, From Value=95 and To Value=95) - the second spec says "Transmission curve below 5% from 780nm to 1100nm".
The selection of the type of specification is done in the first drop-down box, where you can select all the types of specifications defined in ISO 9211-2.
What might be irrritating is the "From Value" and "To Value". This is for absolute specifications to allow "Tilted limit curves" an example is given in the "Default AR-Specification" made on first installation of the software. As you can see life what happens in the graph window, you can play around with the numbers a little and get a feeling.
At the bottom of the dialog are two "Buttons" "Previous" and "Next", where you can switch between the single specifications the full specification is made off. IF you are in the last partial specification, the next Button changes into "add partial" and does what it says: add another partial specification.
In case you added a partial specification too much, you can get rid of it by "Delete Partial".
One thing is not self explanatory in this part of the Dialog, that is the radio buttons at "<" or ">" and "≤" or "≥":
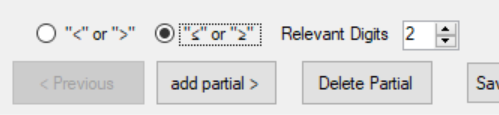
In the case of "<" or ">" the software takes every value and compares it to the specification as it is - no rounding, no mercy, no nothing - values have to be smaller or larger than the specification limit.
In the case of "≤" or "≥" the software takes the values as read in from the specification file, does a rounding to the specified number of "Relevant Digits" and than compares if the values are greater than or equal to the specification limit. This is a differentiation also defined in ISO9211-2 and in this latter case you get much less sensitivity for measurement noise, while "Purists" would say when you only get into the specification by rounding, than you are not in specification.
So it makes a (severe) difference, if the specification in the drawing says "≥" or if it says ">".
For specifications that can be expressed by a single value (like average transmission over a certain range) you can check "Print Value", what adds the actual value in the protocoll, if printing of the specification is activated there. But this is the topic of yet another HowTo.
Finally you can save your specification (well, not in demo mode...) and exit the specification designer and you are done.